Objective:
The topic was focused on the characteristics of resonant RLC circuit for series and parallel circuits. Most importantly, we covered the concept of filters. Filters are used radio and TV. A filter is a circuit that designated to pass signals with a frequency and reject others. A passive filter consists of Resistor, Inductor, and Capacitor. There are also 4 types of filters which are lowpass, high pass, band pass, and bandstop.
Group Practice:
1. The problem below shows a parallel RLC circuit and are told to find the resonance frequency, quality factor, bandwidth, and the half power frequency. When calculating the quality factor, we notice that Q≥ 10, which means that we can use the equation ω1⋍ω0-B/2 and ω2⋍ωo+B/2 to find the half power frequencies as shown in figure 1.
 |
| Figure 1 Calculating resonance frequencies for an RLC parallel circuit. |
2. Based on the circuit, we find the transfer function and then noticed that it a second order low pass filter. Furthermore, we calculate the cutoff frequency by taking the magnitude of the transfer function and setting it to 1/sqrt2. We can then solve for the ωc as seen below.
 |
| Figure 2. Calculating the cut off frequency and the type of filter. |
Passive RL Filter Lab:
1. The lab requires us to measure the response of the voltage across the resistor and the voltage across the inductor to the input voltage. We are required to plot the frequency response( magnitude and phase of both voltages).
 |
| Figure 3. RL circuit with a sinusoidal input voltage. |
2. For the pre lab, we first calculate the frequency response of vL and vR in the circuit shown in figure 3 as a function of R and L. Since both voltage output share the same frequency, then we will only use the inductor value and use a voltage divider as shown in figure 4. We acquire a resonance frequency of 15915Hz
 |
| Figure 4. Calculating the resonance frequency |
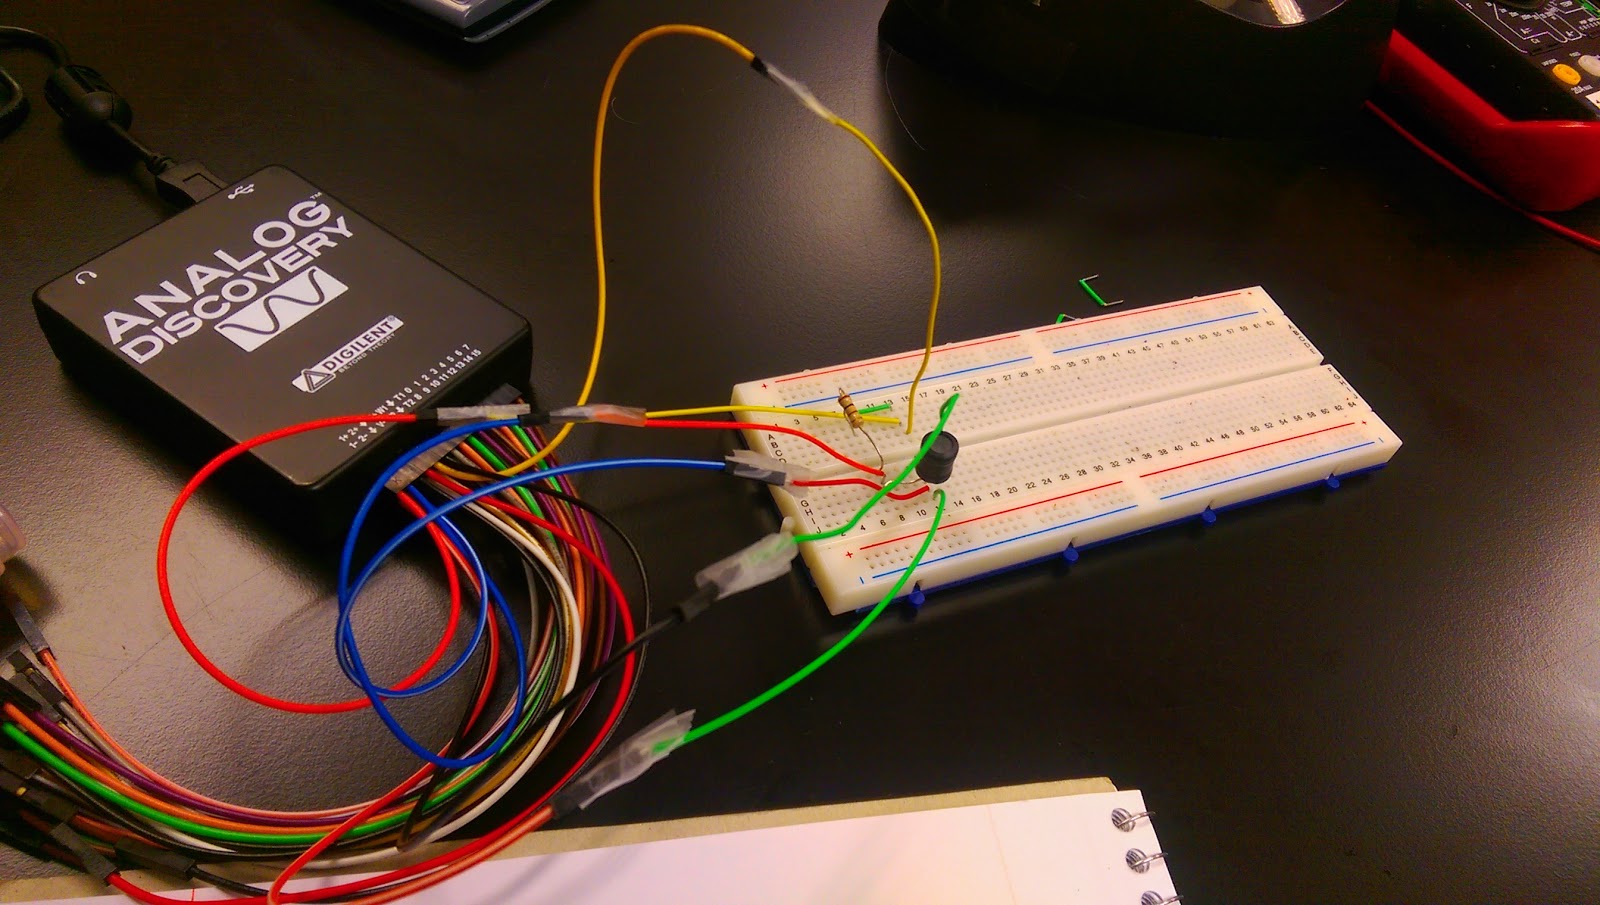
3. The circuit was built based on the lab and the frequency input were converter to hertz and measured the voltage output from the resistor and inductor as well as the input voltage.
 |
| Figure 6. Actual Circuit. |
 |
| Figure 7. Testing different frequencies. |
 |
| Figure 8. Vr at 15915Hz |
 |
| Figure 9. Vr at 159150Hz |
 |
| Figure 10. VL at 1591 Hz |
 |
| Figure 11. VL at 15915Hz |
 |
| Figure 12. VL at 31830Hz |
 |
| Figure 13. VL at 159150 Hz |
 |
| Figure 14. Measurements for V out from resistor and V in |
 |
| Figure 15. Measurements for V out from the inductor and V in |


No comments:
Post a Comment